Documentation
This guide explains how Tracking Assistant is used in real operations, step by step. It is structured to help teams move from setup to governed execution without guesswork.
The content below follows the same practical loop the app supports: define, connect, observe, validate, promote, and document evidence.
Start here
Tracking Assistant is a governance layer for digital tracking operations. It helps teams keep tracking definitions, runtime behavior, and validation outcomes aligned over time.
The app is organized around project tabs that match delivery work: Specs, Assets, Traces, Monitoring, and Protocols.
- Use Specs to define events and parameters.
- Use Assets to scope and activate tracking per runtime target.
- Use Traces for controlled debugging and test runs.
- Use Monitoring for continuous quality visibility.
- Use Protocols to produce auditable validation artefacts.
Core concepts
The product model is intentionally explicit. Most day-to-day work relies on a small set of objects.
- Specification: a versionable contract for allowed tracking behavior.
- Section: a structured part of a specification (text, image, or event grouping).
- Event: a named tracking event with linked parameter expectations.
- Parameter: a tracked key with kind, format, and mode constraints.
- Asset: the concrete runtime scope where tracking executes.
- Trace: a recorded debugging session for event-level inspection.
- Monitoring bucket: aggregated runtime quality signal over time windows.
- Protocol: a test record produced from observed trace events.
Project setup
Start by creating a project and defining basic shared vocabulary.
What to configure first
- Labels: optional taxonomy tags used across events, parameters, formats, and specs.
- Formats: reusable validators (for example regex-based constraints).
- Parameters: reusable parameter definitions with kind and optional format.
- Events: canonical event names that will later be placed into sections/specs.
This first pass should stay lightweight. The goal is to establish reusable building blocks, not model every edge case up front.
Example screens
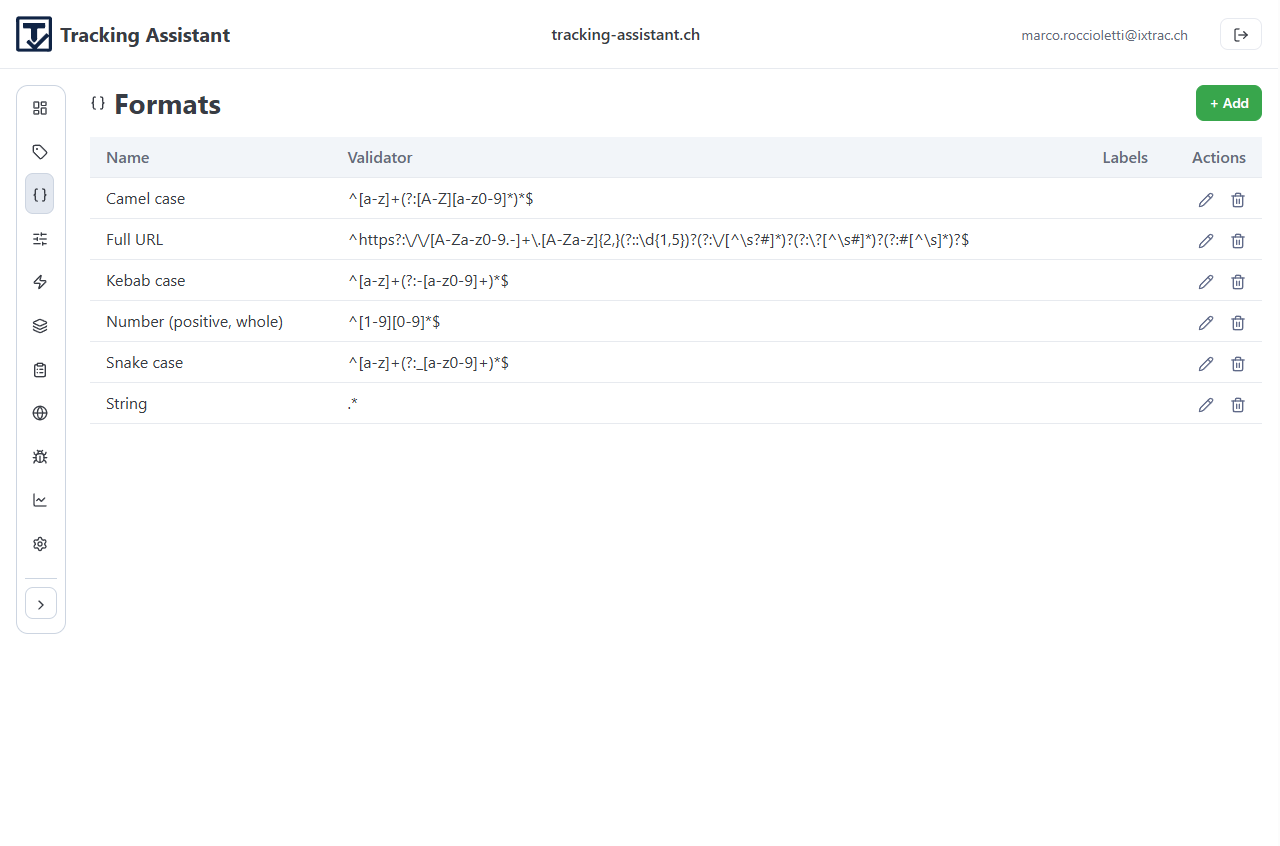
Formats catalog with reusable validators such as case conventions and URL checks.
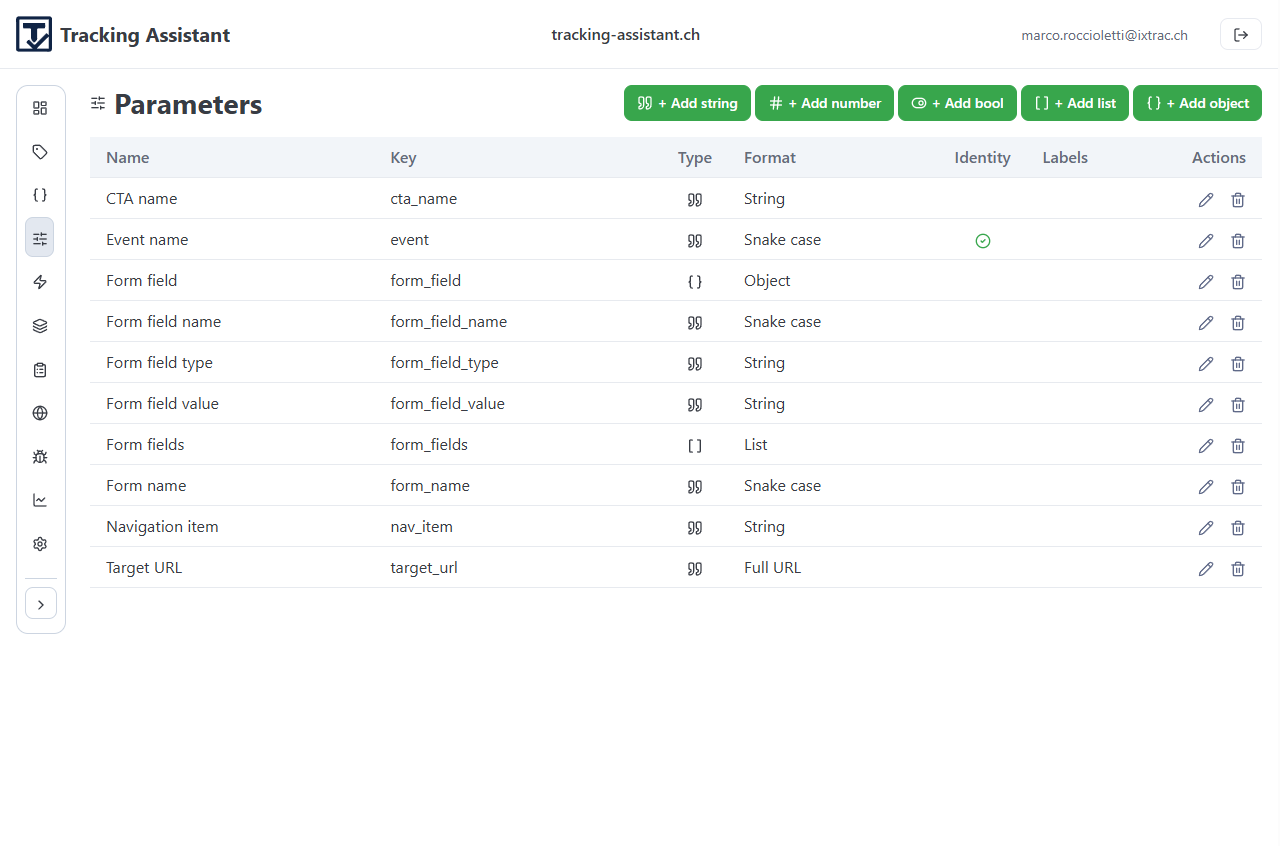
Parameter registry with key names, data kinds, identity flags, and format bindings.
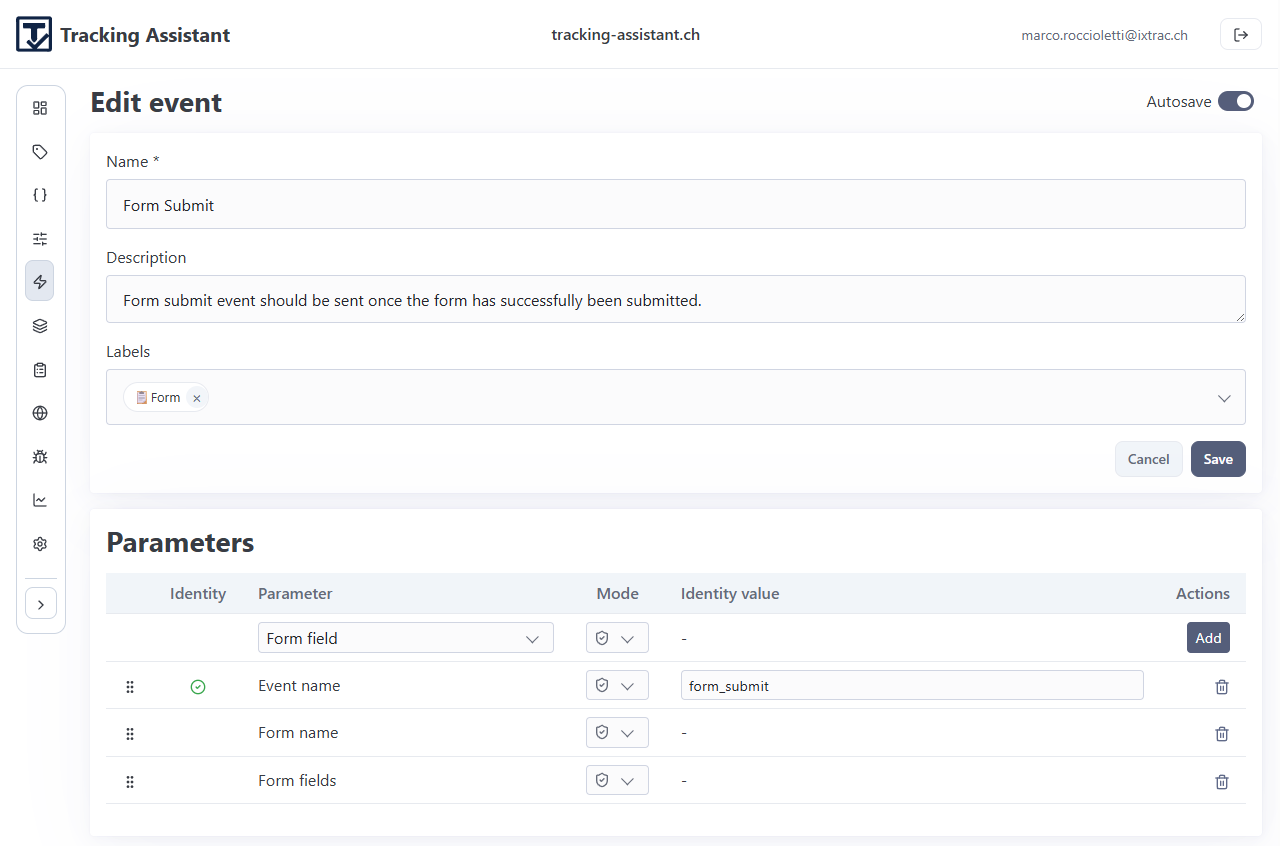
Event editing with parameter list, identity values, and mode configuration.
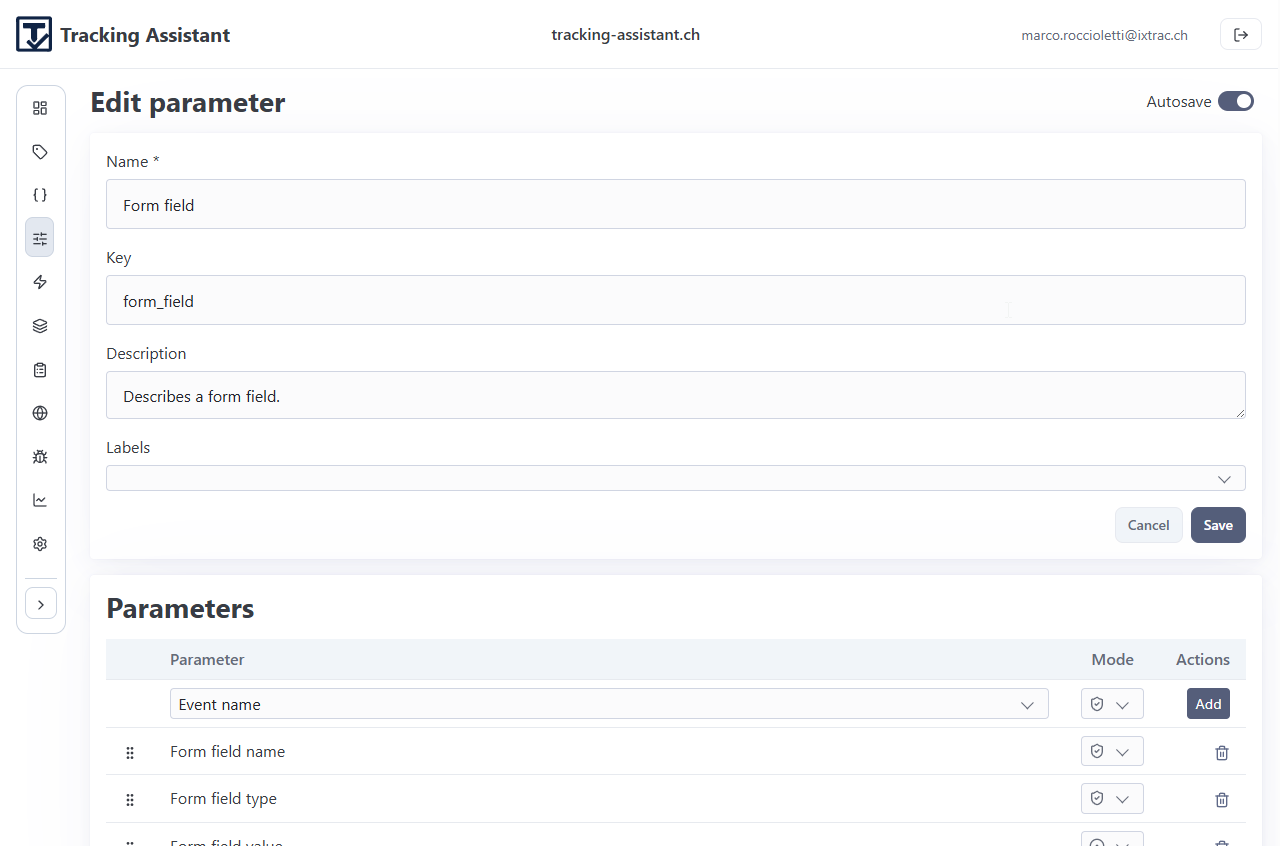
Parameter editing flow with metadata fields and downstream event mode assignments.
Build specifications
Use the Specs tab to turn tracking intent into an explicit structure.
Typical workflow
- Create a specification.
- Add existing sections or create new sections directly from spec management.
- For event sections, link events and define parameter modes (mandatory, optional, forbidden).
- Reorder and indent sections to keep large specs readable.
- Create a spec version once a milestone is stable.
Version snapshots are important operational checkpoints. They let teams reproduce what was expected at a given point in time and generate stable PDFs.
Open example specification PDF (v3)Example screens
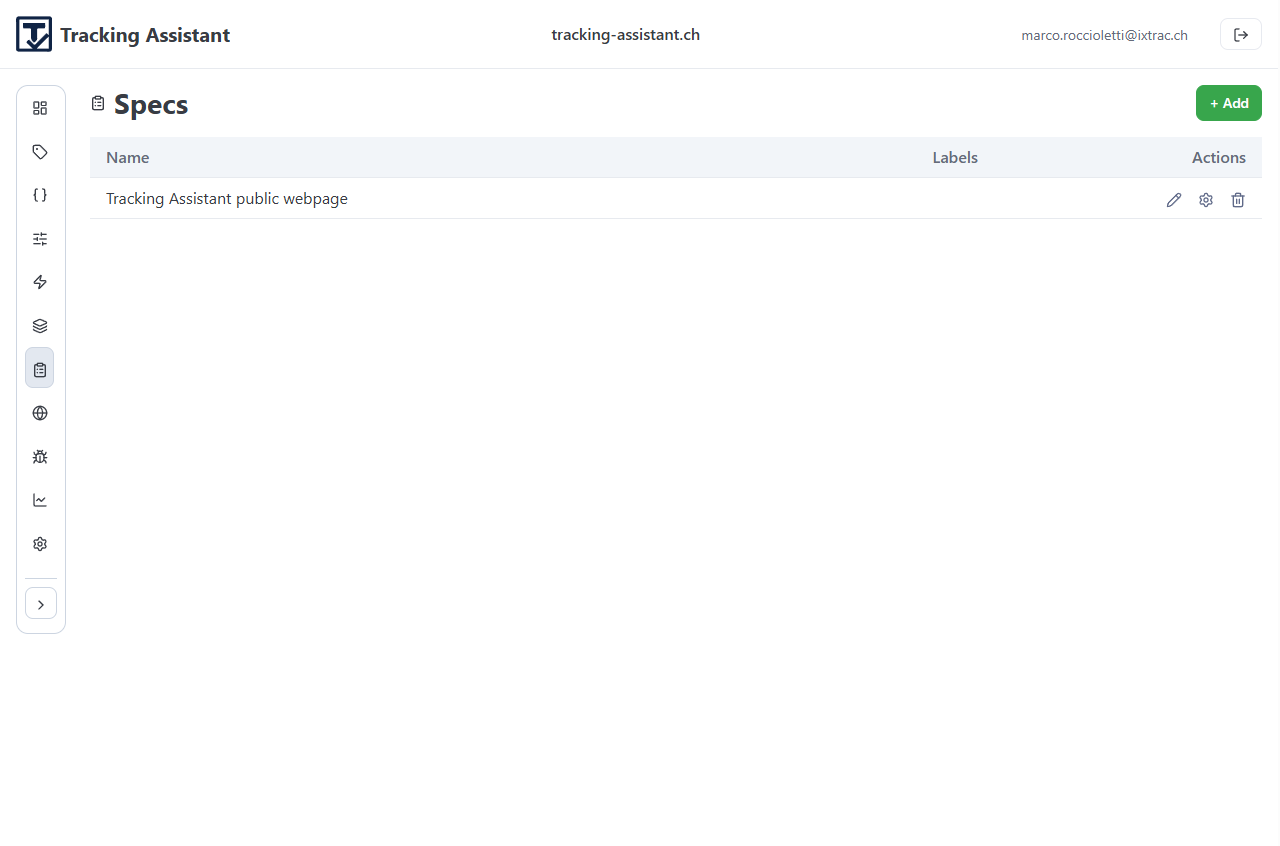
Specifications list with primary management actions.
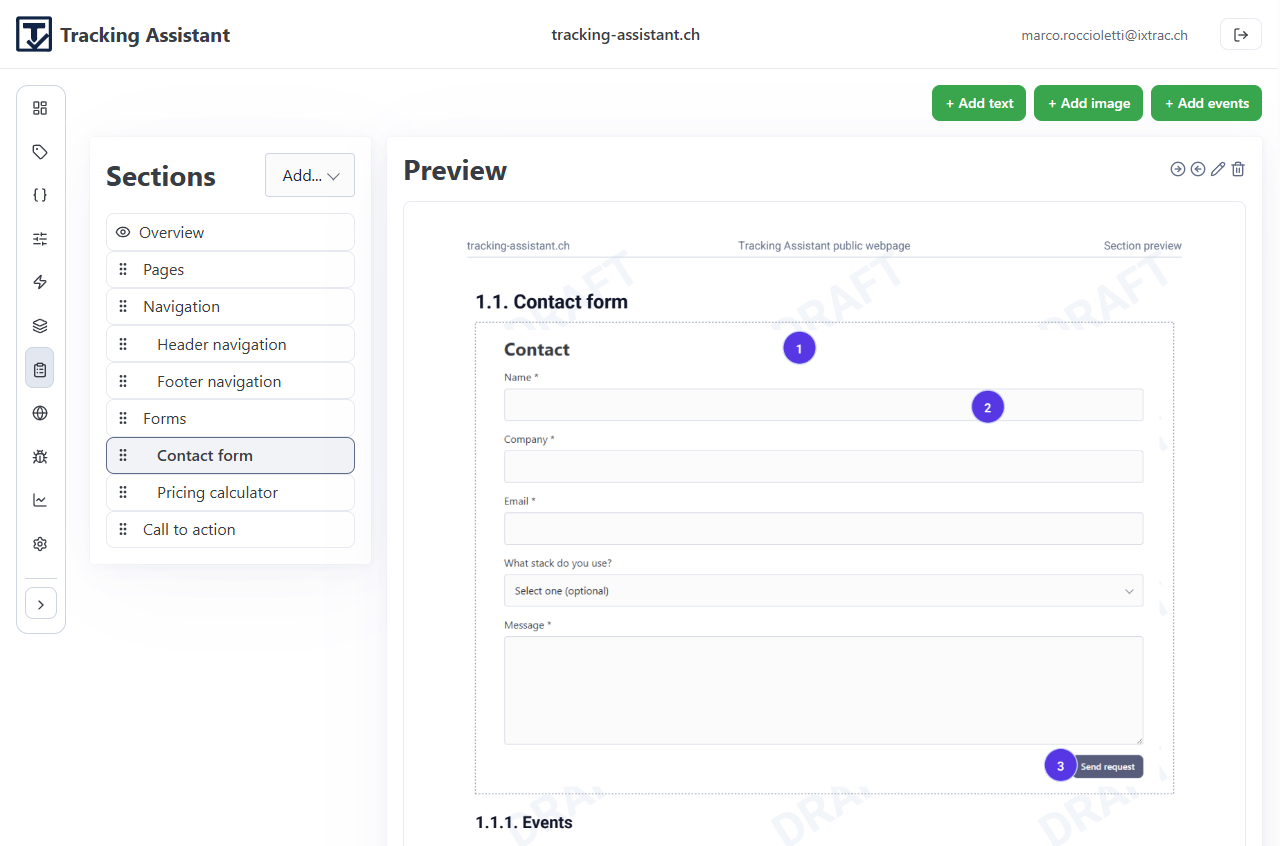
Spec manage view with section hierarchy and rendered preview.
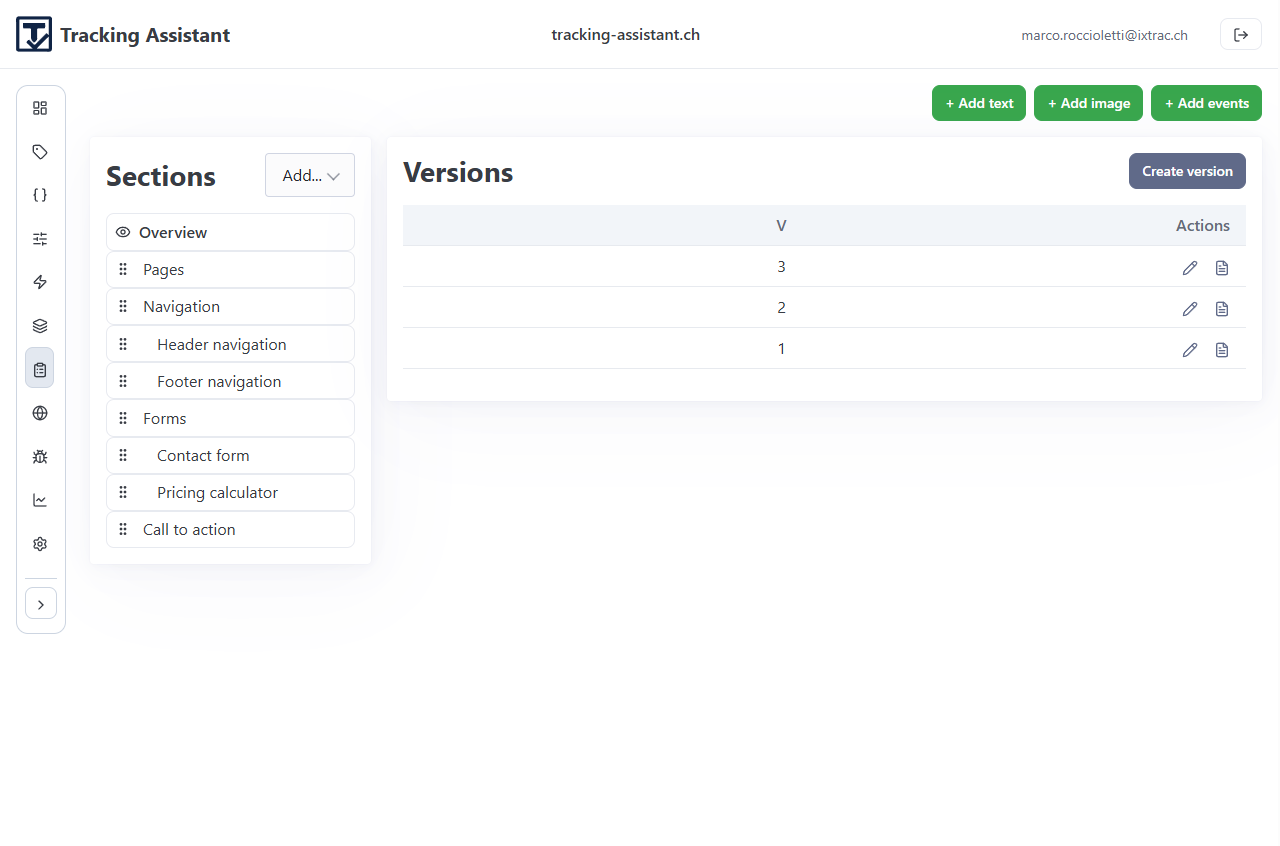
Version history with create and PDF access actions.
Connect assets
Assets connect specifications to real runtime scopes.
What needs to be set on each asset
- Name and ownership context.
- Trace start URL for debugger flows.
- Activation toggles for debugging, tracing, and monitoring.
- Monitoring retention setting.
- Linked specifications, ordered by relevance.
Roll out incrementally: one production-critical asset first, then expand.
Example screen
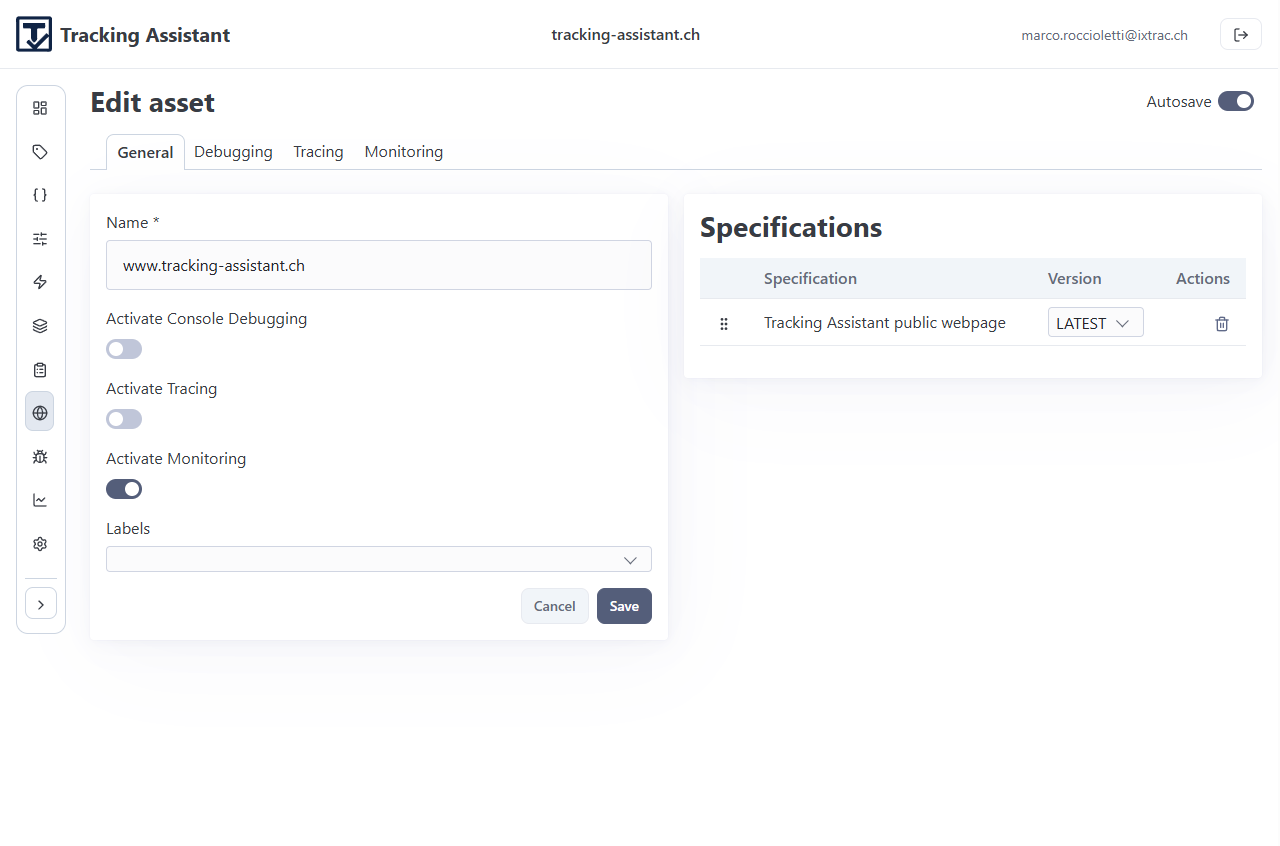
Asset settings with runtime toggles and linked specification versions.
Debug with traces
Use Traces when validating implementation behavior during development or release checks.
How teams use traces
- Create a new trace for an asset.
- Start polling and reproduce the relevant user flow.
- Inspect captured events and parameter-level validation status.
- Open event detail views to identify unknown events, missing parameters, and format errors.
- Select representative events and create a protocol draft.
Tracing should be used to shorten feedback loops before issues reach long-term monitoring.
Example screen
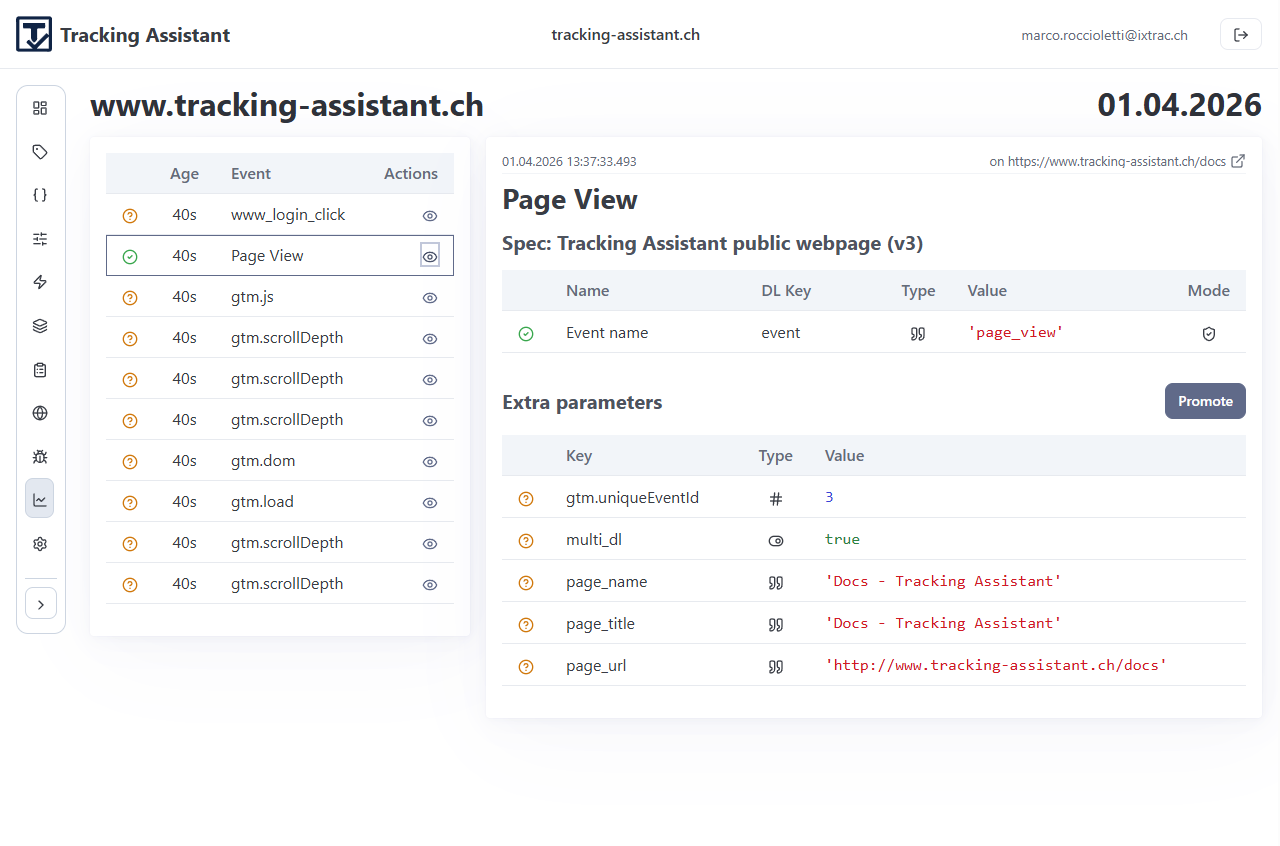
Trace detail panel showing validated fields and extra captured parameters.
Run monitoring
Use Monitoring for continuous runtime oversight after deployment.
Panels and purpose
- Overview: quality trend and daily bucket view.
- Detail: event-level drill-down for a selected day/asset.
- Bucket view: itemized records for investigation and follow-up actions.
Monitoring is where drift becomes visible over time. Unknown and error signals should feed back into specification and implementation updates.
Example screens
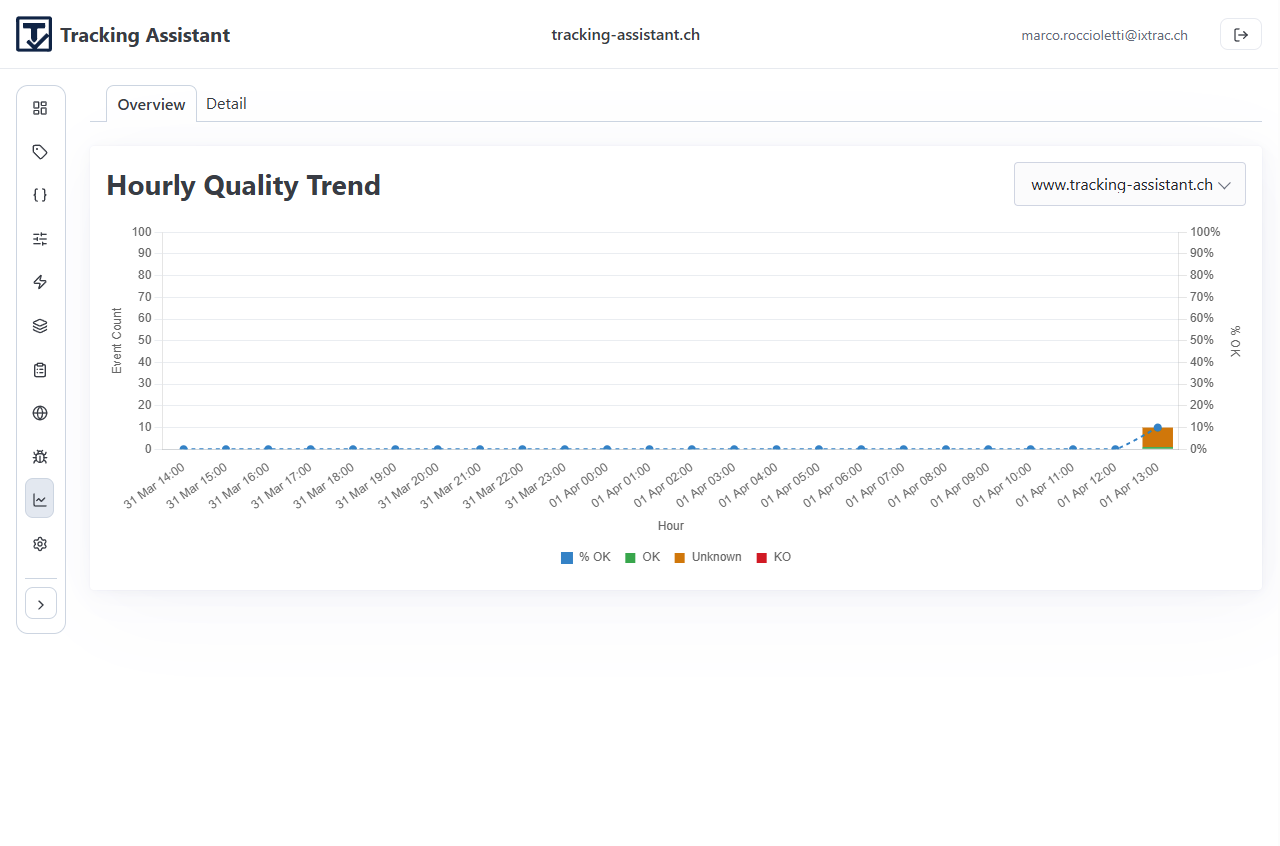
Hourly quality trend with OK, unknown, and KO distributions.
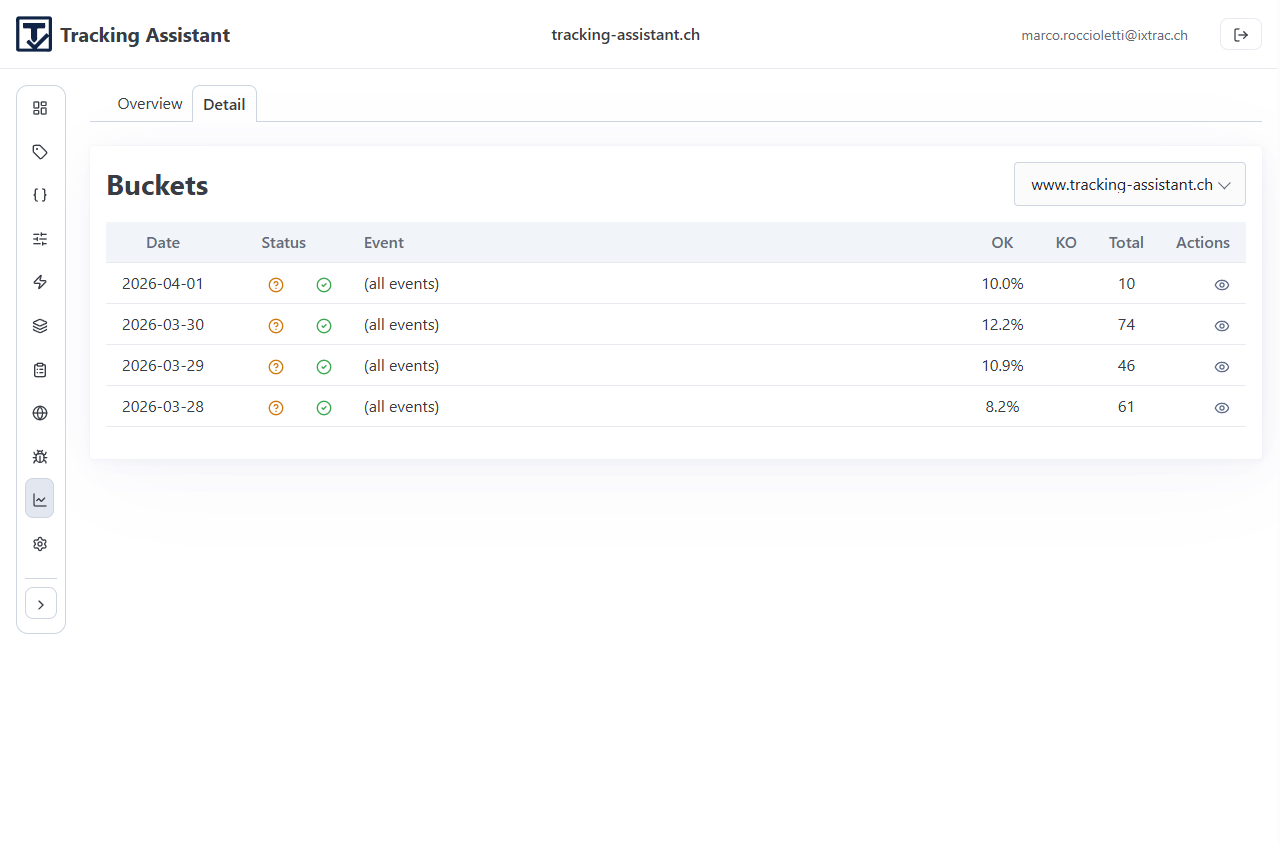
Daily bucket list for drill-down and event-level investigation.
Promote safely from observed data
Promotion flows convert observed runtime deltas into controlled specification updates.
Supported promotion actions
- Promote extra parameters for known events.
- Promote completely new events discovered in traces or monitoring.
- Map promoted items to existing parameters where possible.
- Create new parameters with explicit kinds and formats when needed.
- Attach promoted events to chosen spec/section targets.
This closes the loop between observed behavior and governed definition while keeping change explicit.
Example screens
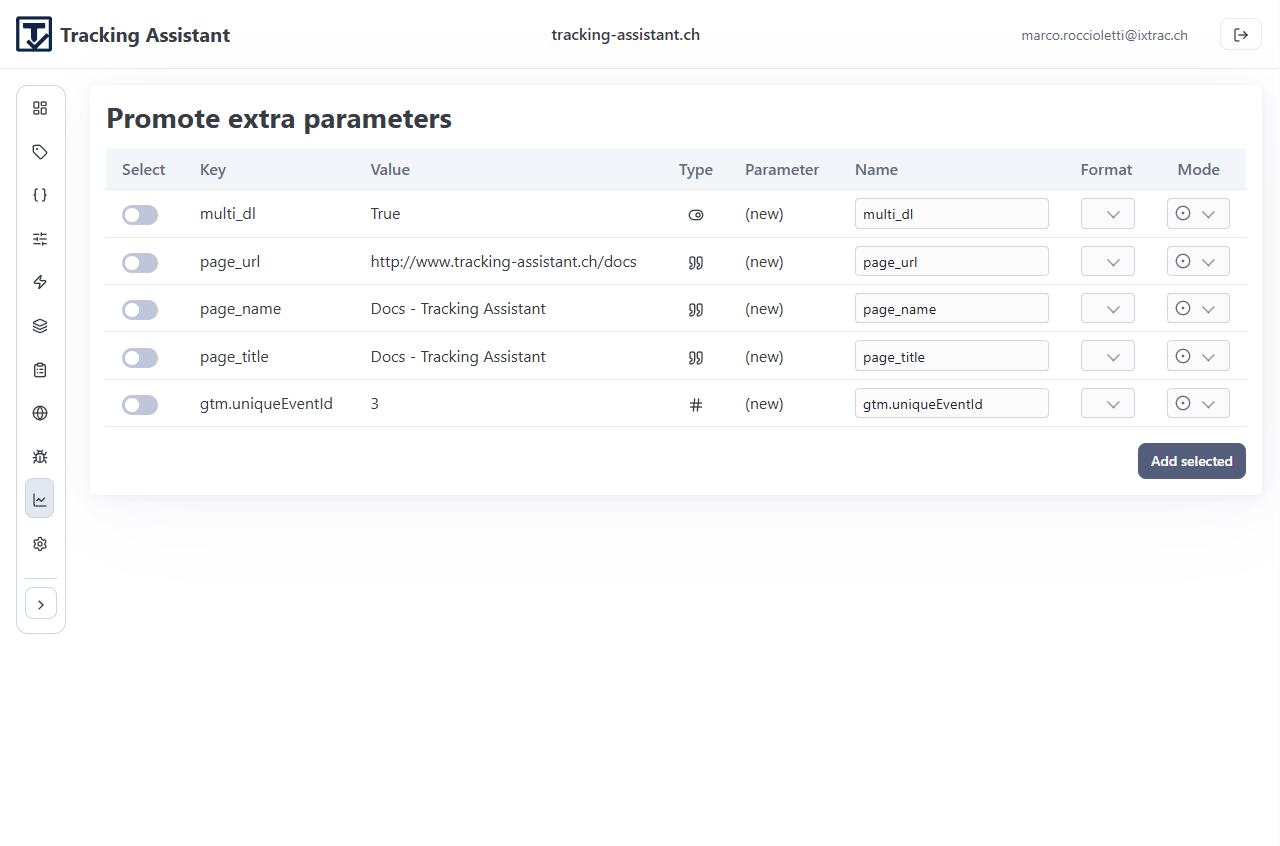
Promotion table for adding newly observed extra parameters.
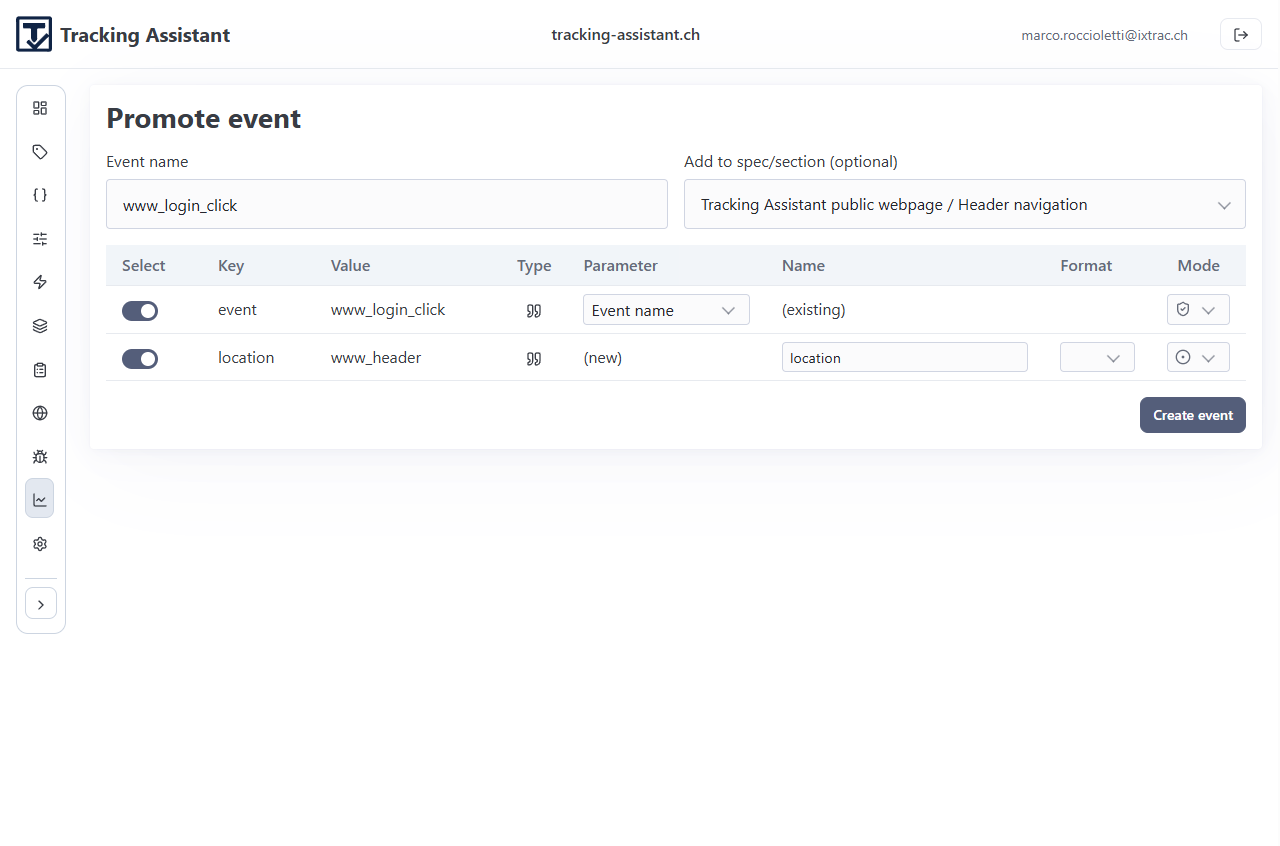
Promote event flow with mapping and optional spec/section target.
Protocols and evidence
Protocols turn selected trace observations into structured, reviewable test artefacts.
Protocol workflow
- Create a protocol from selected trace items.
- Edit comments and expected values where needed.
- Insert additional expected events for full scenario coverage.
- Save and re-run when implementations change.
- Export protocol PDFs for audit and delivery records.
Treat protocols as living operational evidence tied to runtime behavior, not static documents.
Operating routine for teams
A stable cadence keeps governance practical and lightweight.
- Weekly: review monitoring overview and top error/unknown buckets.
- Per release: run targeted traces on changed user flows.
- After incidents: promote validated deltas and version affected specs.
- Monthly: refresh protocol set for critical journeys.
Ownership works best when product, analytics, and engineering share the same workflow instead of splitting definition, validation, and reporting responsibilities.
Need help with your exact rollout path?
Share your current stack and we can map the first project setup and governance routine with you.